
The Funnel Was in the Data. The Labels Were Lying.
Someone asks RevOps for the funnel. Not a dashboard full of activity counts, but the actual motion from first response to meeting, qualified opportunity, and outcome.
The data exists, but it does not live in one place. The CRM holds opportunity stages, lifecycle changes, and forecast movement. The marketing automation system holds campaign responses and pre-opportunity engagement. Gong, Salesloft, Clari, and similar platforms hold calls, meetings, conversation activity, and outcomes.
Each system describes a fragment of the same journey. A CRM stage, campaign response, meeting disposition, and activity label may represent one conversion point without sharing a name or timestamp convention. A polished funnel built from any one source can be complete and still be wrong, including a data warehouse.
We are introducing the new QFlow Conversions Agent. It turns those scattered events into one reusable conversion dataset, aligning what happened across the revenue engine with the motion RevOps expected to happen.
Define the real conversion points
The Conversions Agent starts with the business question, not the source system. What separates successful webinar engagement from activity that creates no pipeline? What percentage of booked qualification calls are completed, ghosted, or rescheduled? Which activities consistently precede advancement to stage three or above?
Each question describes a conversion flow that RevOps can reuse. QFlow follows the person, company, or deal appropriate to the question, then brings campaign responses, calls, meetings, stage changes, and outcomes into the same view. A person’s activity is not mistaken for company progression, and deal movement is not credited to everyone involved.
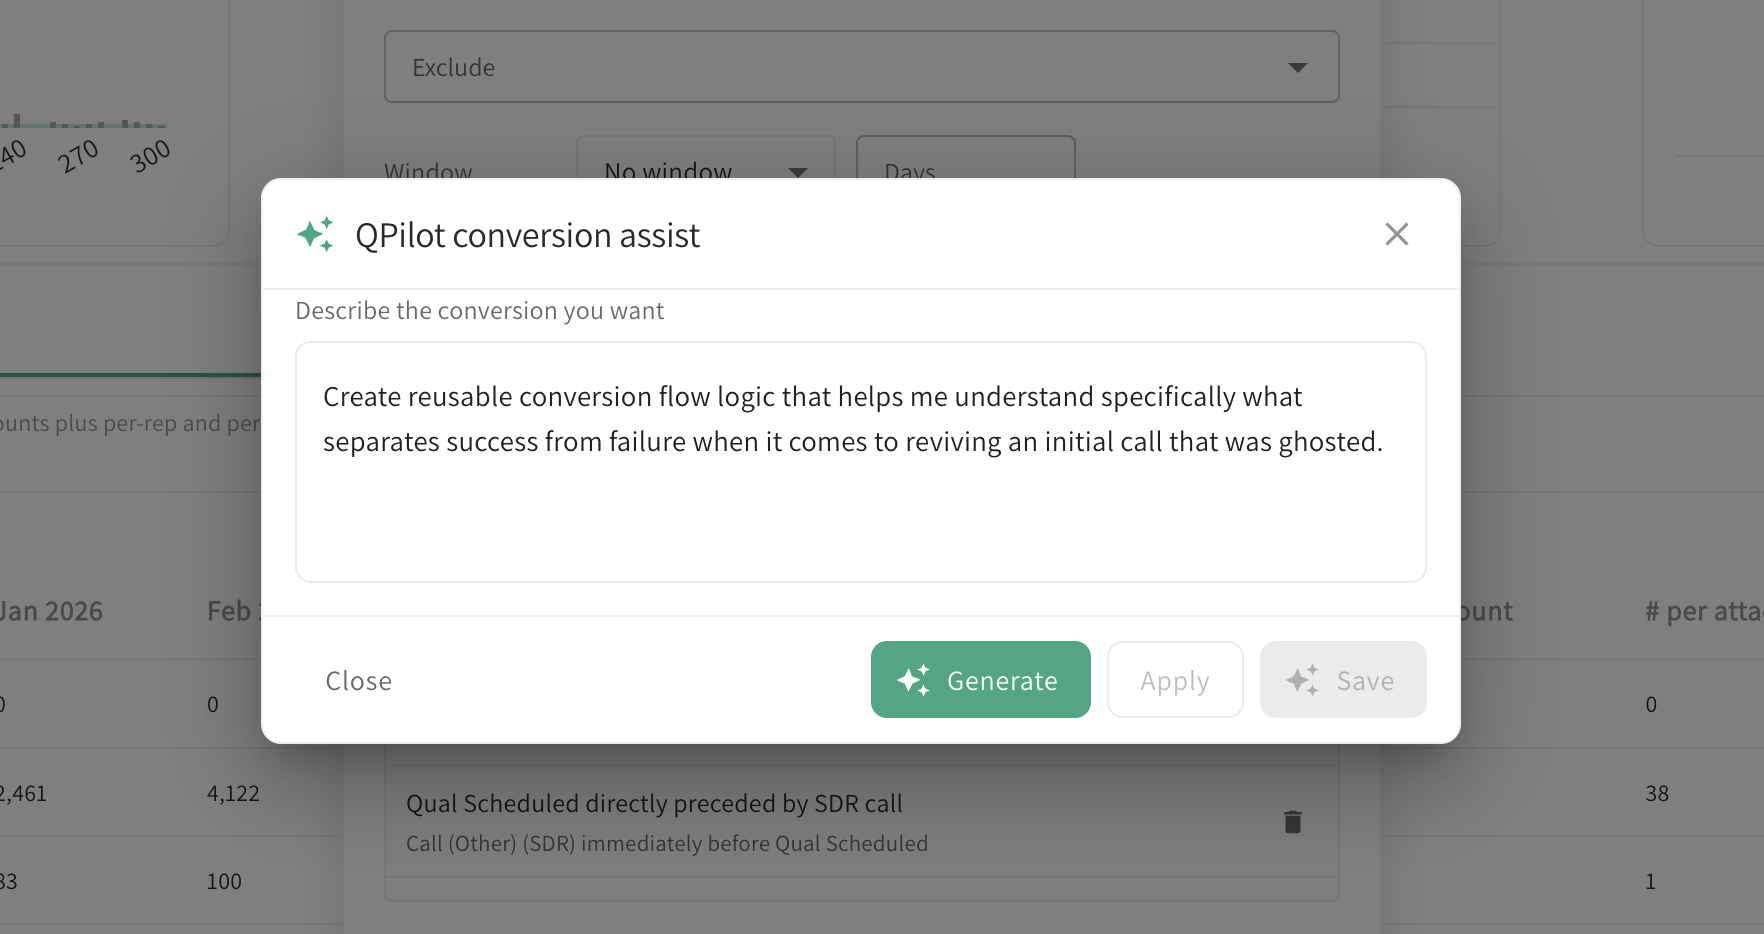
RevOps can ask QPilot to create the flow in plain language, review it, and save it. The same definition can describe a narrow handoff or an end-to-end motion without changing the rules each time leadership asks for a new cut.
QFlow combines the events into one timeline, removes duplicate activity, and makes missing or unlogged steps visible. Teams can compare the route customers actually took with the motion they expected, without first forcing every source system to use the same labels.
Measure rate, timing, and volume
One saved flow becomes the basis for three views of performance. Conversion rate shows how many people, companies, or deals reached each point and where they dropped. Timing shows how long the movement took. Volume can be measured as a count, ARR, or opportunity amount.
Those answers change capacity plans. Meeting completion and ghost rates reveal how much booked calendar time becomes usable selling capacity. Activity-to-stage progression shows how much work the team needs to create qualified pipeline. A CRO can separate a demand, capacity, or conversion problem. A CFO can test whether headcount and program-spend assumptions fit the rates and timing the business actually produces.
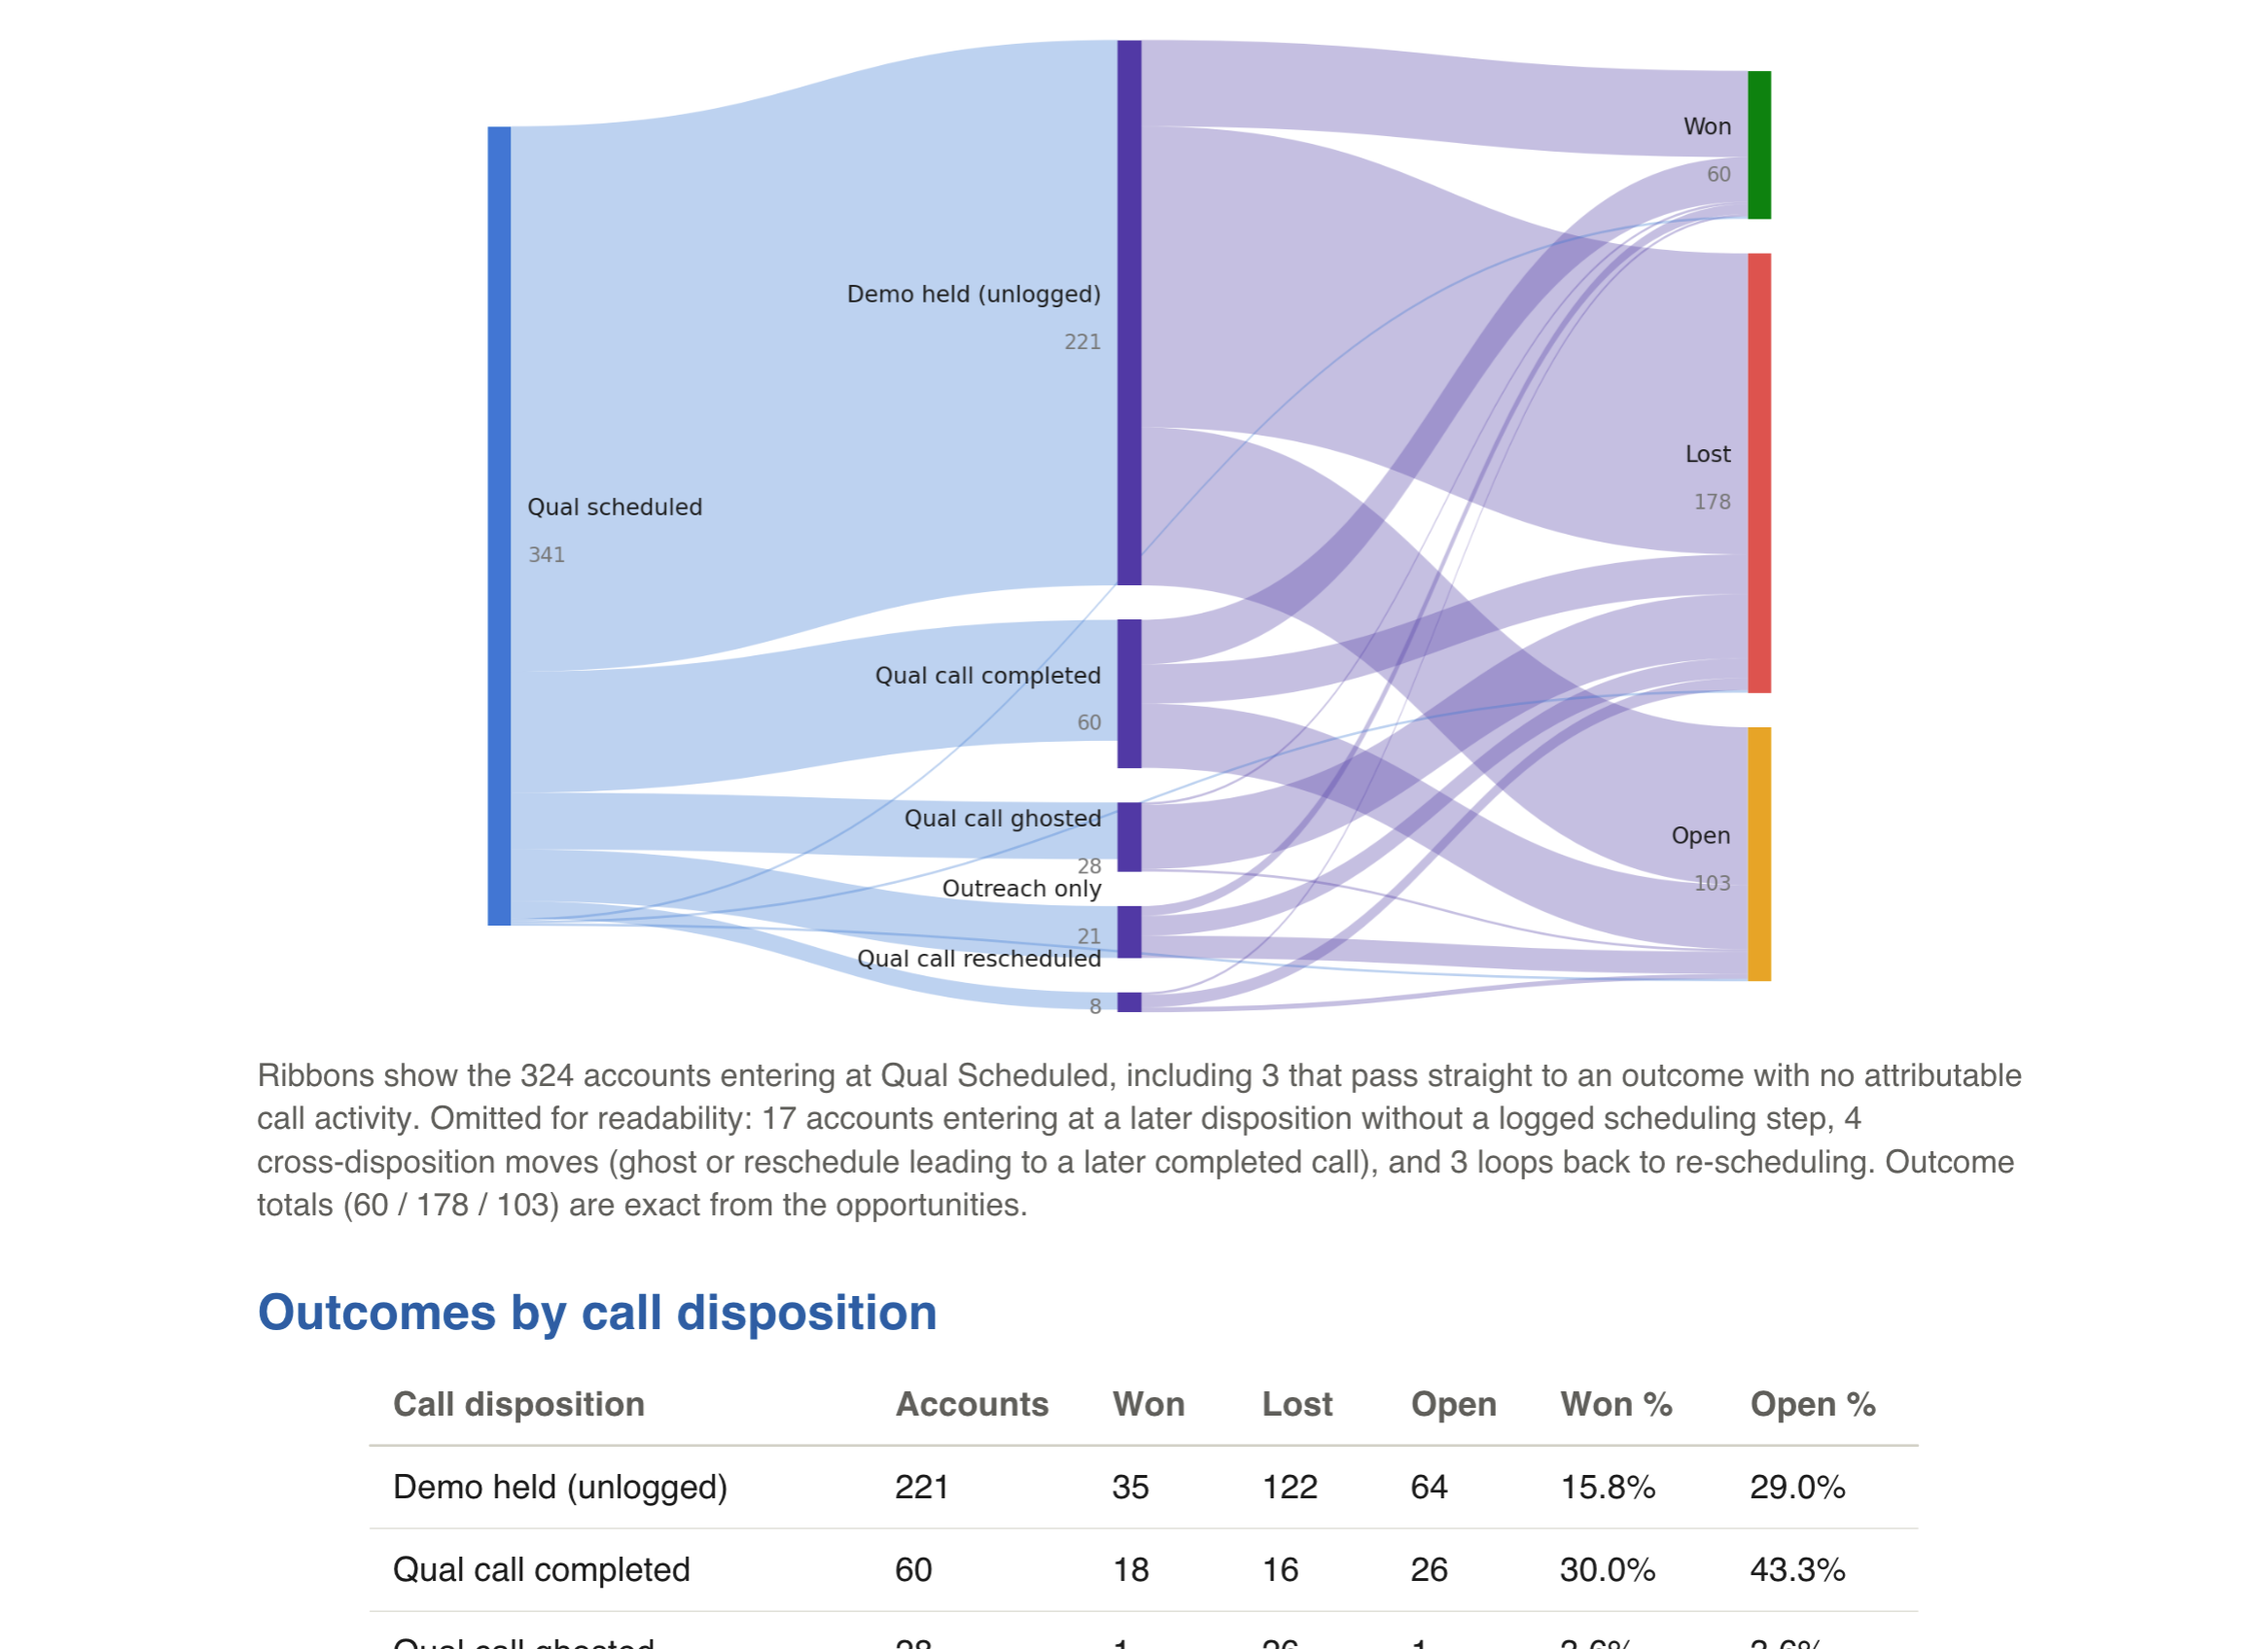
The qualification analysis above makes this concrete. Scheduled calls split into held, completed, ghosted, rescheduled, and outreach-only routes before reaching won, lost, or open outcomes. Second attempts and loops back to rescheduling remain visible instead of disappearing into one average.
Use the same dataset everywhere
Save the question once and it is not trapped in one visualization. QFlow Recipes can rerun webinar, meeting, or stage-advancement analysis on a schedule. Through QFlow’s MCP server, teams can interrogate the same cleansed dataset directly from Claude Desktop, Codex, Claude Code, and other compatible tools.
A weekly capacity review and an ad hoc leadership question begin with the same data and definitions. RevOps can compare segments, inspect the companies behind a route, or examine what happened after a selected conversion point without rebuilding the funnel.
Leadership no longer has to choose between a meaningless summary of mismatched labels and a painstaking manual reconstruction across thousands of events. RevOps defines the motion once. The QFlow Conversions Agent keeps the expected sequence, observed activity, conversion rate, timing, and volume together.
The funnel was in the data across all those systems. The labels were making it hard to see.