
Reconcile Pipeline Movement with QFlow's Pipeline Balance Sheet
A CRO and CFO can agree on beginning pipeline and ending pipeline and still disagree on what happened between them.
Sales remembers the deals that slipped. Finance sees the aggregate decline. Bookings may look healthy while next quarter’s coverage quietly thins. The numbers are correct, but two snapshots do not explain the motion.
QFlow’s Pipeline Balance Sheet gives both leaders the missing bridge. It reconciles the pipeline expected to close in a quarter from the beginning of an analysis window to the end, then carries every movement back to the opportunities behind it.
The CRO sees the selling motion. The CFO sees numbers that tie out. They enter the meeting with one operating picture.
Make the quarter tie out
A pipeline snapshot answers what is open now. It cannot explain how the quarter arrived there.
QFlow’s Pipeline Balance Sheet starts with the opportunities whose close dates placed them in the selected quarter at the beginning of the analysis window. That historical boundary matters. When a deal is later pushed, pulled, closed, removed, or resized, the original cohort does not disappear from the story.
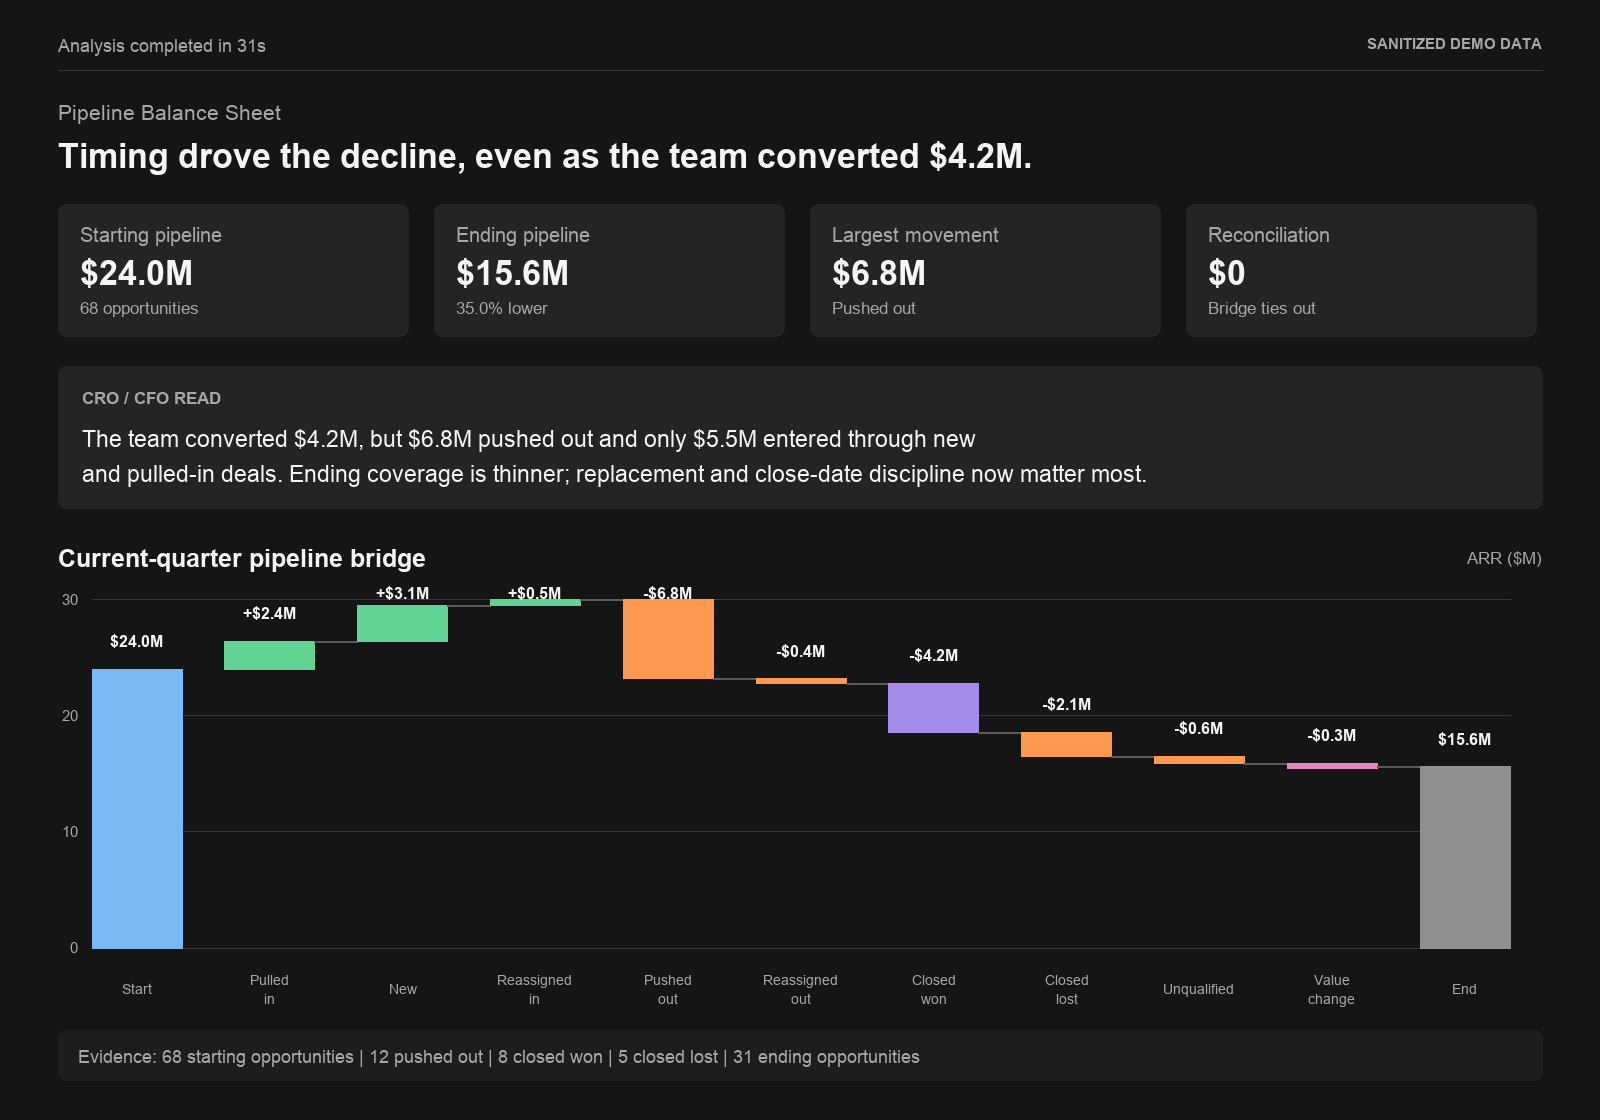
The arithmetic is direct: starting pipeline, plus inflows, minus outflows, plus value changes, equals ending pipeline. New and pulled-in opportunities add to the quarter. Pushes, losses, unqualified deals, and other exits reduce it. Changes in opportunity value capture expansion or contraction. QFlow calculates the reconciliation difference so the bridge either ties to zero or exposes a problem in the underlying data.
This is more than a waterfall chart. It is a controlled explanation of how pipeline changed.
Read the movement correctly
The same movement can mean something different to sales and finance. Closed-won leaves open pipeline because it converted into bookings; it is not negative performance. A push-out is a timing change, not automatically attrition. Closed-lost and unqualified pipeline are different again: that value left the selling motion.
Those distinctions prevent a strong bookings number from hiding a weaker ending position. In the analysis above, the team converted pipeline, but pushed-out value remained the largest outflow and new plus pulled-in pipeline did not replace what left. The CFO can follow the bridge from opening to closing balance. The CRO can see that the immediate question is pipeline replacement and close-date discipline, not simply whether the team booked revenue.
QFlow also keeps informational measures such as total bookings separate from the movements that mathematically reconcile pipeline. The operating story stays useful without breaking the accounting logic.
Carry the opportunities into the room
Every line item in QFlow’s Pipeline Balance Sheet is connected to its opportunity-level drilldown. Open Pushed Out and the team can inspect the deals, owners, values, and close-date changes behind the total. Open Value Change and finance can see which opportunities expanded or contracted. Open Closed Won and the CRO can distinguish conversion from pipeline depletion.
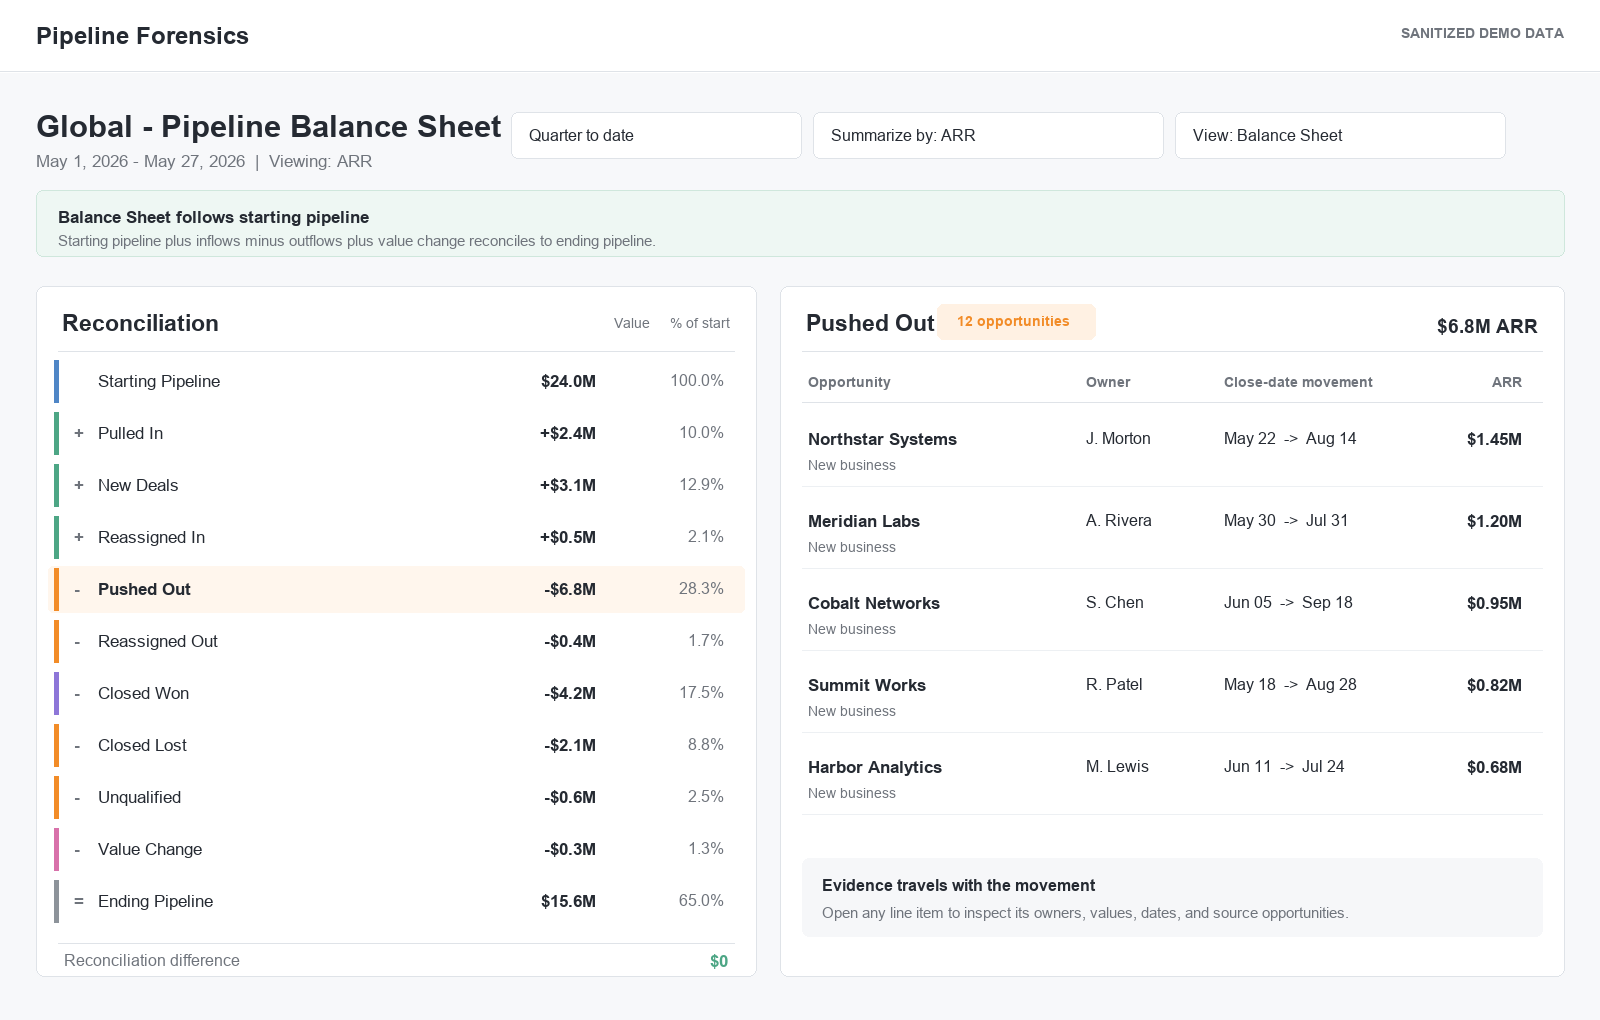
The drilldown changes the meeting. Sales no longer has to reconstruct the quarter from remembered deals, and finance no longer has to accept an unexplained aggregate. Both teams can challenge assumptions while staying anchored to the same movements and source opportunities.
Pipeline Forensics turns the forecast review from a comparison of snapshots into a reconciled account of what changed, why it changed, and where leadership needs to look next.