Data Storytelling with GTM Stats
Great RevOps teams understand the importance of data. But turning raw numbers into meaningful insights that resonate with leadership, investors, and frontline teams? That’s an art form too often delayed by complexity, manual data wrangling, and endless formatting tweaks.
At QFlow, we believe that growth instrumentation and reporting should be swift, automated, and aligned to your business’s unique metrics. We built GTM (Go-To-Market) Stats to help companies reach executive-ready analytics in a single afternoon—no massive IT projects, no months-long onboarding, just instant clarity and ROI.
Now, we’re taking the next step: Data Storytelling with GTM Stats, a set of new capabilities that make shaping, customizing, and narrating your growth data easier than ever before. From dynamic chart ordering and curated brand colors to integrated commenting and voiceovers, we’re giving you more control over how you present your data—without sacrificing the speed and simplicity you’ve come to expect from QFlow.
Why Data Storytelling Matters
In the boardroom, at investor meetings, and during internal strategy sessions, the difference between a “meh” deck and a “wow” deck is in the narrative. Data storytelling transforms raw stats into a cohesive arc that shows where you’ve been, where you’re headed, and what’s driving growth.
Historically, constructing that narrative took time—lots of it. Months, sometimes years, just to set up stable reporting pipelines, double-check calculations, and format the visuals so they match your brand. The complexity didn’t end there: you had to align different teams on what matters and what doesn’t, and then repeat the entire process each quarter.
With QFlow, we eliminated the heavy lifting by automating best-practice datasets. And now, we’re introducing features that empower you to tell a story with those numbers. Where we’re heading is the difference between a generic growth chart and a fully produced documentary—complete with a director’s cut, your chosen soundtrack, and a compelling narrative.
What’s New in GTM Stats

Customizable Data Sets & Layout:
Your growth metrics aren’t one-size-fits-all. With the new GTM Stats enhancements, QFlow admins can pick and choose which stats appear, how they’re ordered, and what context is provided. Maybe you want your win rate front and center, and an emerging regional sales metric tucked neatly at the end. Or perhaps you want to remove certain datasets that don’t support your current narrative. It’s all under your control now.
Voiceovers & Descriptions:
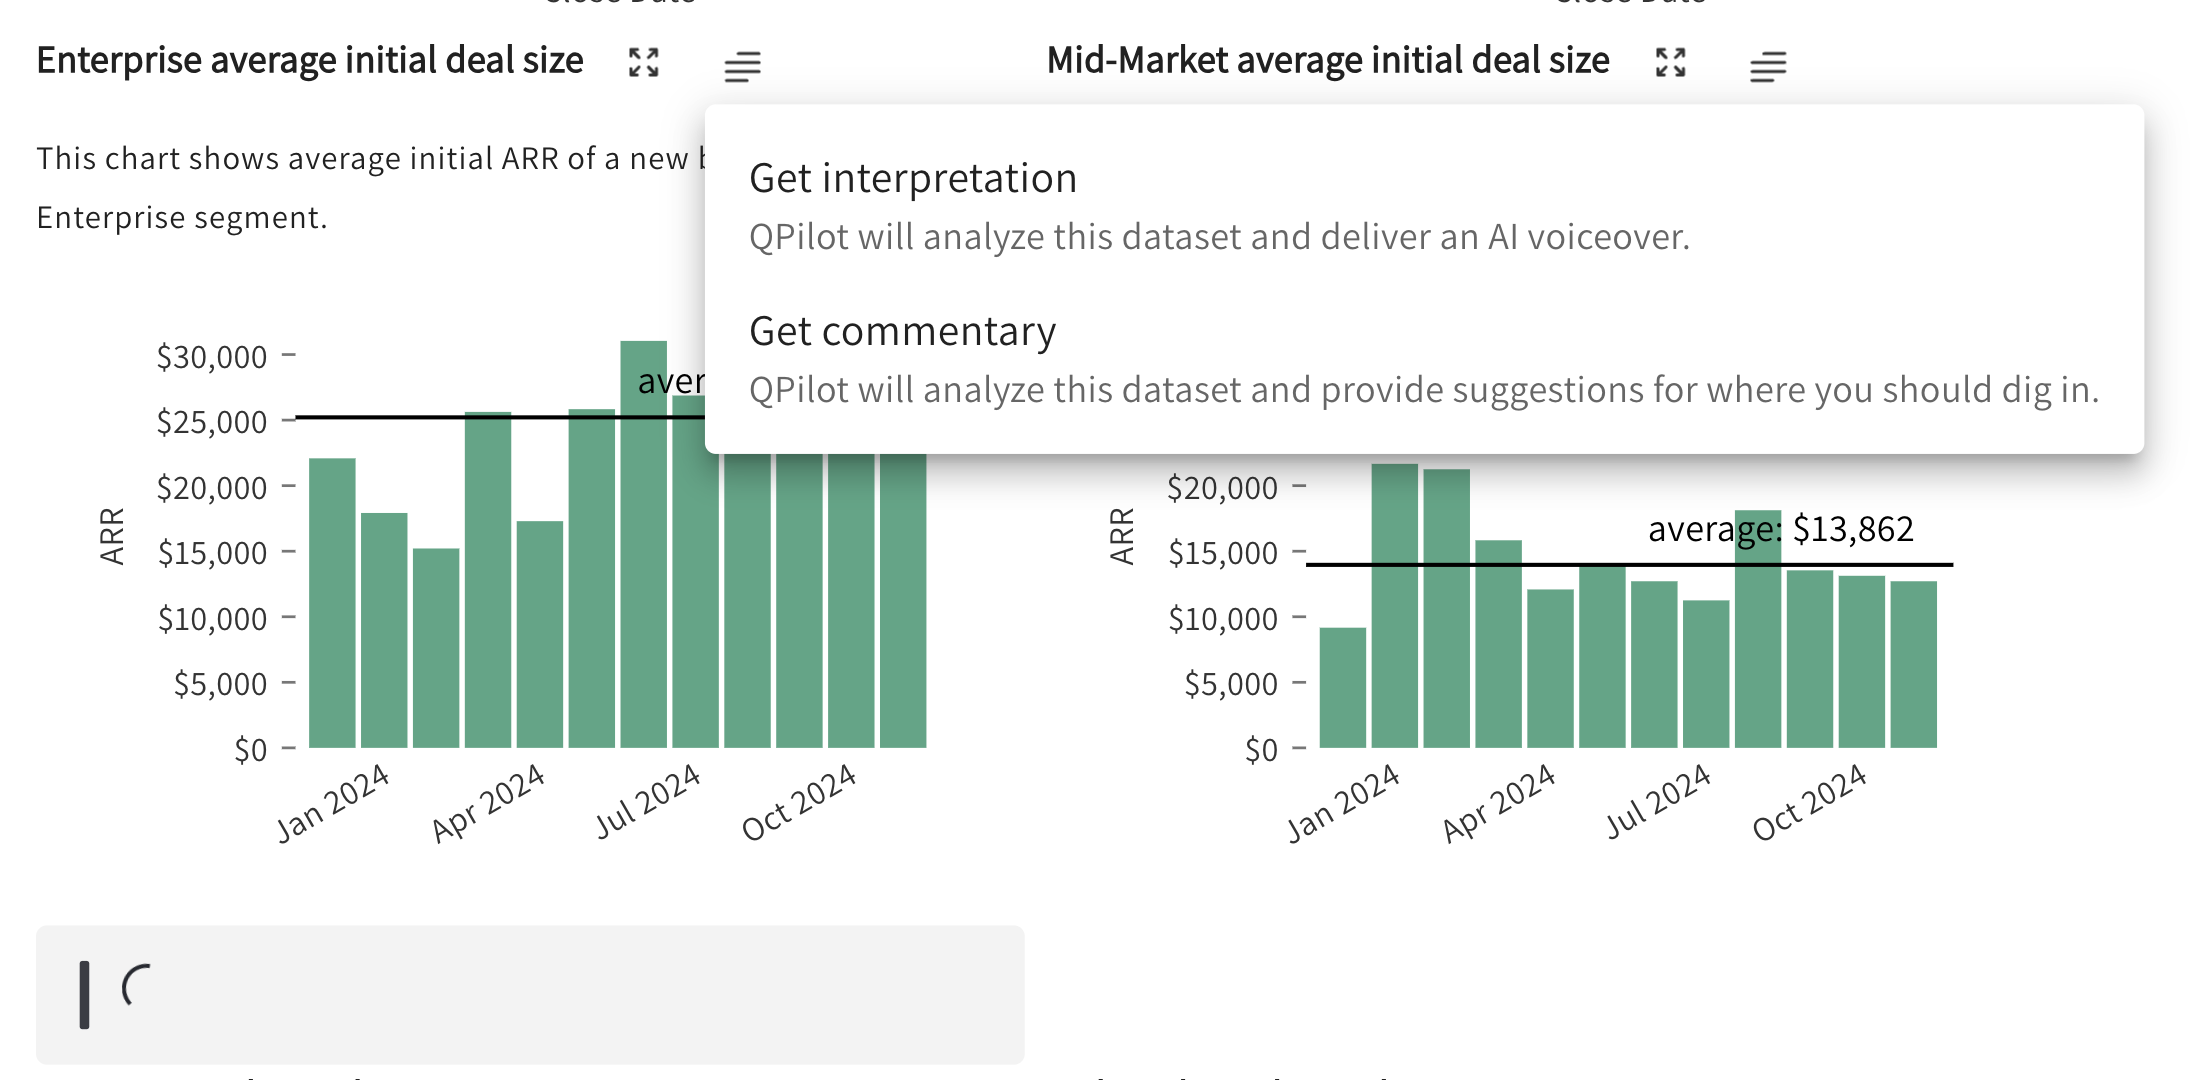
We know that context is everything. Now you can add official voiceovers or detailed descriptions directly within QFlow. Explain why that new win rate calculation differs from the old Excel-based method. Highlight how a pricing adjustment influenced average sales cycle length. With easy-to-publish descriptions, you ensure everyone—executives, managers, and investors alike—gets the right story every time.
Brand-Consistent Visualization:
Data visuals should feel like they’re part of your brand. That’s why we’ve introduced the ability to select approved brand colors before exporting charts. So the next time your GTM leaders prepare a board deck, the visuals won’t just be accurate and insightful—they’ll be on-brand and ready for primetime.
Collaboration & Comments Everywhere:
Great stories emerge from dialogue. That’s why we’ve extended our popular collaboration and commenting features to every stat. Team members can leave inline comments, ask questions, and suggest changes. Integrated with Slack and email, these comments ensure everyone stays on the same page. It’s no longer a data monologue—it’s a conversation that evolves into a refined narrative.
Use Cases: Where Data Storytelling Shines

-
Educating Your Teams on New Metrics:
Suppose QFlow reveals a more accurate way to calculate win rate, replacing a cumbersome Excel model. With this update, you can publish a detailed description right next to the chart. Now your sales leaders, SDRs, and even your CFO can understand the why behind the numbers—instantly boosting adoption and trust. -
Polishing Board Decks with Ease:
Board meetings require consistency, clarity, and brand alignment. Pre-select your company colors in QFlow, rearrange datasets to highlight key takeaways, and export ready-to-use visuals. No more last-minute design tweaks in PowerPoint or panicky Slack messages to marketing. Just frictionless, professional presentations. -
Tailoring Insights to Relevant Narratives:
You’ve discovered that your recent price increase is linked to longer deal cycles. Great. But maybe you don’t need to clutter the story with metrics that aren’t relevant this quarter. With QFlow, selectively hide or deprioritize stats, focus on what matters, add a note explaining your reasoning, and invite your cross-functional partners to weigh in. Together, you’re crafting a narrative that’s both data-driven and context-rich.
How It Works
-
Navigate to the GTM Stats View:
Head to the QFlow dashboard and open GTM Stats. All of the new storytelling features are baked right in—no separate logins, no add-ons required. -
Use the Sidebar to Toggle and Rearrange:
Quickly show or hide datasets, reorder charts, and tweak your presentation with a few clicks. -
Enter Full-Screen Mode for Editing:
In full-screen mode, you can publish updated dataset descriptions, fine-tune data visualization colors, and download high-resolution images. Need the raw data? Export to CSV with a single click. -
Collaborate with Comments:
Want feedback? Ping your team with integrated comment functionality tied to Slack and email. Build consensus, refine the narrative, and finalize your story faster than ever.
Availability
Good news: There’s nothing you need to do to start telling better stories with QFlow. The new storytelling and collaboration features are live right now in the GTM Stats tab for all users on Professional and Enterprise plans. Just log in, explore the new options, and transform your data into a narrative that drives decision-making.
Jump into QFlow’s GTM Stats and start shaping your story today. Your stakeholders—and your future self—will thank you.
