QFlow.ai Spring 2026 Product Updates
Spring brings powerful new automation capabilities to QFlow, with Agentic Recipes leading the charge alongside enhanced forecast triangulation and GTM visualization improvements.
Introducing Agentic Recipes
QFlow is evolving into a recipe-based platform. Instead of navigating dozens of pre-built dashboards, you now describe what you need and let AI assemble the analysis—mapping complex queries, filters, and aggregations against battle-tested GTM finance datasets.
The new data selector surfaces views contextually, only when needed, while Recipes handle the heavy lifting: inferring intent, orchestrating deterministic calculations, and scheduling work that previously required a dedicated analyst.
How it Works
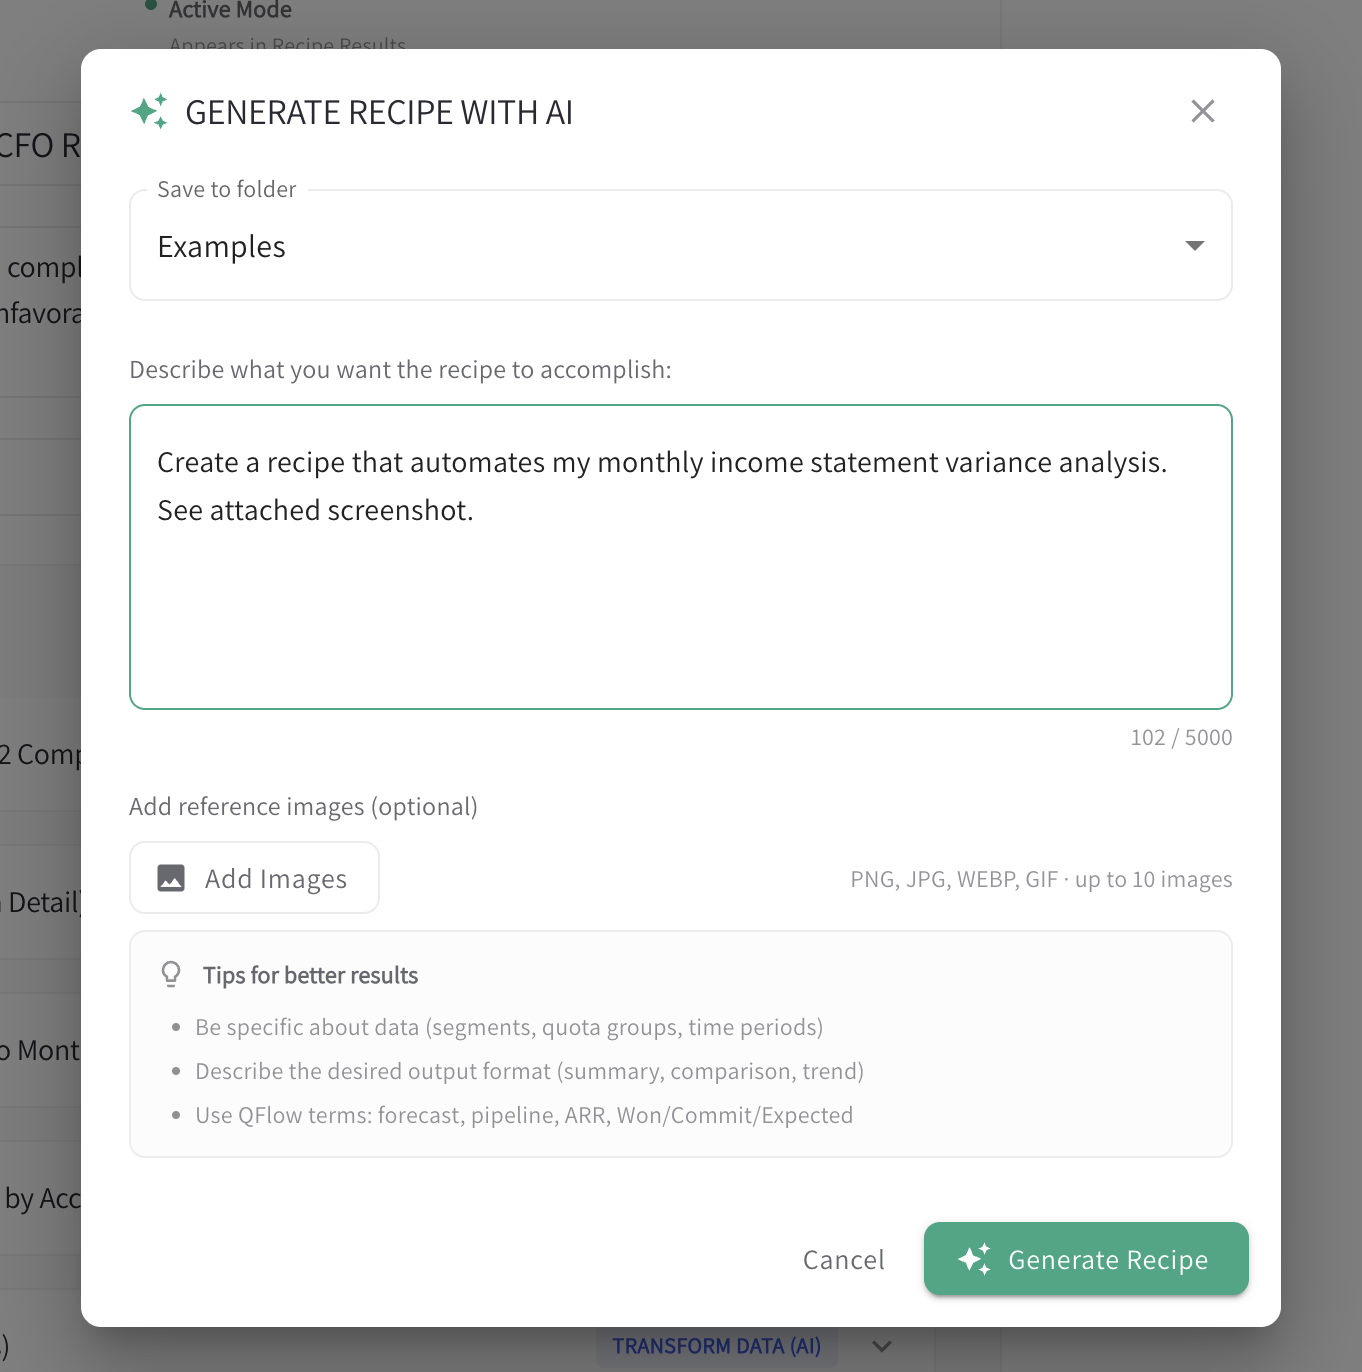
AI Recipe Builder + AI Optimizer Start from plain English, then continuously improve with AI suggestions grounded in actual run results.
Debug Mode for Business Logic Pause at breakpoints, step through logic, rerun specific steps, and inspect output at every stage—bringing software engineering rigor to revenue analysis.
Prebuilt Analytics + Deterministic Data Tools Use conversion, variance, checkpoint, and transformation tools together to get speed without sacrificing trust.
Automation You Can Trust Schedule by timezone with flexible cadence options, reusable templates, and clear health/failure tracking.
From Insight to Action Embed charts in narrative outputs and distribute results via Slack, Teams, or email with delivery-level transparency.
Examples of What Customers are Building
Executive Reporting Recipes automate board updates with forecast coverage, pipeline health, closed-won vs. goal, and CFO/CRO talking points—complete with charts. Build 6-month ARR waterfalls by movement type (new, expansion, contraction, churn, retained) with board-ready visuals.
Pipeline Intelligence Recipes calculate conversion metrics (Qual Scheduled → Opps Passed) by segment and owner, identify past-due opportunities grouped by rep with CRM links, and surface the top 10 at-risk deals by ARR with next-step recommendations.
Financial Analysis Recipes analyze income statement data and explain top variance drivers by account, department, and vendor—turning months of manual analysis into a single click.
Scenario Planning Recipes compare forecast models and quantify quarter-by-quarter ARR impact, showing exactly which assumption changes drive the delta.
👉 Why this matters: AI excels at narrative but fails at math. Recipes pair deterministic data operations (for precision you can audit) with AI intelligence (for insights that tell the story)—giving you automation you can defend in a board meeting. No more choosing between speed and accuracy.
Improved Forecast Triangulation in Business Digest
We’ve enhanced the Business Digest with improved forecast triangulation capabilities, helping you reconcile multiple forecasting methodologies and identify discrepancies before they become board-level surprises.
👉 Why it matters: Early adopters using enhanced triangulation landed within 3.23% of their predicted scenario outcome just 25 days into the quarter—proof that reconciling sales-driven, finance-driven, and AI-driven forecasts creates more reliable predictions. These methods aren’t just analytical exercises; they’re management tools that help teams identify gaps, adjust execution, and improve performance before variances compound. Triangulation builds confidence in your numbers and gives leadership the clarity to act decisively.
Improvements to GTM Stats Visualization
GTM Stats now features enhanced visualization options that make it easier to spot trends, compare cohorts, and communicate insights to stakeholders who need the story behind the numbers. Every stat is now delivered with an automatic AI voiceover from QPilot, turning data into narrative insights you can listen to while reviewing the charts.
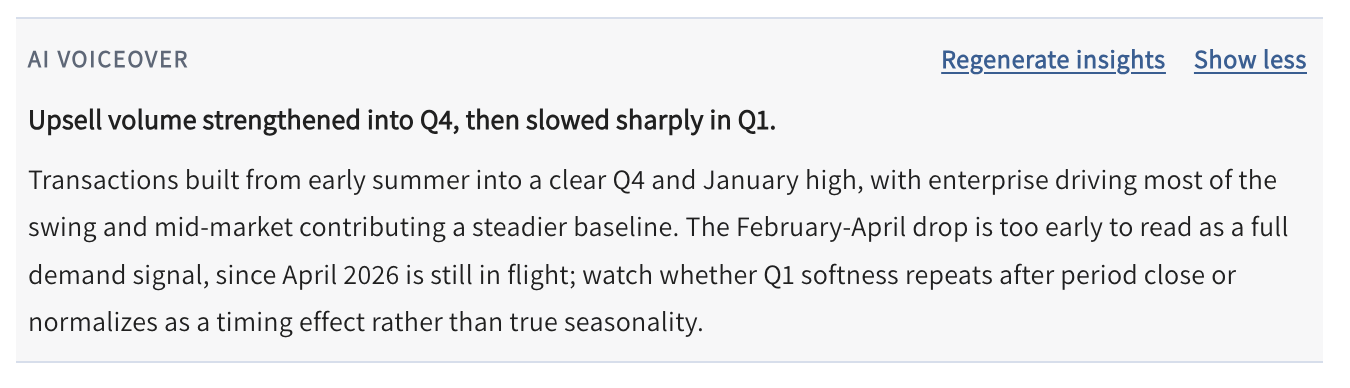
👉 Why it matters: The new Compare By control and composition options (stacked vs. separate) let you switch analytical perspectives instantly—no more rebuilding filters or exporting to spreadsheets. Built-in QTD and FYTD views keep trend detail and executive summaries connected in one chart experience, flowing through to exports that are ready to share with stakeholders. Teams get faster KPI interpretation and clearer performance narratives, whether they need to show contribution mix or side-by-side comparisons.
New Integrations: Salesloft & Clari
QFlow now connects to Salesloft and Clari, bringing unstructured call recordings and email data directly into your revenue intelligence workflows. This enriched signal layer improves forecast accuracy and surfaces hidden patterns in customer conversations.
By ingesting conversation data from your sales engagement platform and revenue operations hub, QFlow’s AI can identify deal risks, buying signals, and competitive dynamics that structured CRM data alone misses—giving you earlier warnings and sharper predictions.