How to Build Multi-Quarter (Annual) Forecasts in Salesforce
We’ve written about in-quarter sales forecasting and the importance of data hygiene and sound, repeatable process when it comes to calling your current quarter accurately.
Since writing that post, the revenue operations space has further converged on helping sales teams facilitate in-quarter forecasts. Clari is raising capital hand over fist, Gong has moved laterally to offer deal forecasting, and there’s talk that Outreach.io will do the same.
It makes sense. This is easy software to build. It doesn’t require an outsized product investment or effort. And since tools like Clari come at a high price, carrying lengthy setup times, there should be plenty of B2B companies willing to adopt more affordable knock-offs.
But with all the focus on predicting where companies will land their current quarter, is everyone missing the point? We think so.
- The allure and shortcomings of focusing on the current quarter
- Benefits of multi-quarter forecasting
- Challenges with multi-quarter forecasting
- What a multi-quarter forecast should achieve
- How to assemble a multi-quarter forecast
- Assembling multi-quarter forecasts on QFlow
The allure and shortcomings of focusing on the current quarter
B2B companies tend to focus resources and brainpower on predicting where they will exit their current quarter. For the average sales-led organization, what else would make sense? Miss your number enough times, that’s it: go sell for someone else. A good in-quarter forecast—and revisiting next-quarter goals—is absolutely necessary.
But there are some limitations with an overemphasis on the in-quarter forecast.
First, the approach (obviously) limits line-of-sight to the next 90 days and more realistically, 45 days. Nasty surprises may lurk around the corner.
Second, trends and insights are slow to develop. They’re only available after a software solution has been implemented, teams have been trained, and the solution has had full adoption for at least 1-2 quarters.
Third, key stakeholders to revenue outcomes tend to sit on the sidelines as spectators when in-quarter forecasting is the sole focus. This means that finance teams must sift through endless reports, navigate shifting assumptions, and worse—endless opinions—from marketing and sales professionals.
We built QFlow to prove that a scalable, data-driven approach to multi-quarter forecasting is possible, so we feel qualified to discuss what goes into building a multi-quarter forecast for companies using Salesforce.
Benefits of multi-quarter forecasting
There are many benefits to adopting multi-quarter forecasting. To name a few, it:
- allows senior leadership to take longer term, unified views of the business
- enables finance to plan more effectively
- makes realistic, ambitious goals (and quotas) easier to set
- can unlock headcount earlier for key hires (esp. relevant in our labor market)
- incorporates marketing data and product plans, creating skin in the game
Done properly, multi-quarter forecasting shouldn’t require massive changes to frontline operations. It can even make in-quarter forecasts more accurate by smoothing out biases in terms of deal size and timing.
Enlightened CROs (and counterparts in Finance) increasingly see opening the aperture as a driver of smart growth.
Challenges with multi-quarter forecasting
The problem is that assembling an intellectually honest multi-quarter forecast is difficult.
Even for the most forward-looking CROs, the reality of short-term goals creates pressure. For CFOs and their teams, creating a longer-term outlook is simultaneously an exercise of thoughtfulness, data engineering, definition-setting, and then a fair amount of cat-herding.
We can also lay some blame with tools and skills.
Most B2B companies use a CRM like Salesforce. It’s great for collecting data that can be used for a bottom-up, short-term forecast.
Salesforce is not great at pointing out characteristics of leads or deals that lead to success and does little to reduce error in human judgment when performing bottom-up inspection. It doesn’t analyze our business or translate trends into heuristics that we can communicate to teams. It’s also not great at producing the marketing and sales statistics (conversion rates, conversion timing, outlier elimination, etc.) needed for a bottom-up forecast.
These deficiencies aren’t easily addressed. Some companies go all-in and allocate data engineers, data scientists, and analysts to the problem. This is an expensive approach in which success is not guaranteed. The majority end up taking a simpler (but dangerous) approach, straight-line future revenue against figures like sales headcount, and periodically refresh metrics and gather opinions. Not ideal.
So what is, ideally, going into a proper multi-quarter sales forecast?
What a multi-quarter forecast should achieve
Let’s establish what we are (and are not) trying to achieve here.
We are not setting out to build an all-knowing oracle that can predict the future and send your teams home from work early. The goal is to build a repeatable process that helps us make better decisions.
Based on a statistical analysis of past results, we can establish a set of key business attributes or metrics, and show you what your future will likely be if the metrics remain unchanged.
Done properly, management should be able to easily modify these input metrics and change assumptions around bottom-up contributions and immediately see the impact on revenue performance.
How to assemble a multi-quarter forecast
We will constrain our focus here to what’s required for a new business ARR forecast.
In order to predict ARR bookings, there are four things your model must address:
- ARR bookings that have taken place
- Known sales opportunities you have on hand
- Known prospects without sales opportunities (yet)
- Prospects and opportunities that you will generate in the future
Let’s break down the components.
ARR bookings that have taken place
This is the easiest part of your multi-quarter forecast. Hopefully when an opportunity is booked as “Closed Won” in Salesforce, you have a robust process for automatically calculating the recurring revenue associated with the contract. ARR is not a GAAP measurement—it’s traditionally a SaaS measurement. It represents expected revenue over the course of the contract with a customer should your customer renew continuously for twelve months.1

Known opportunities you have on hand
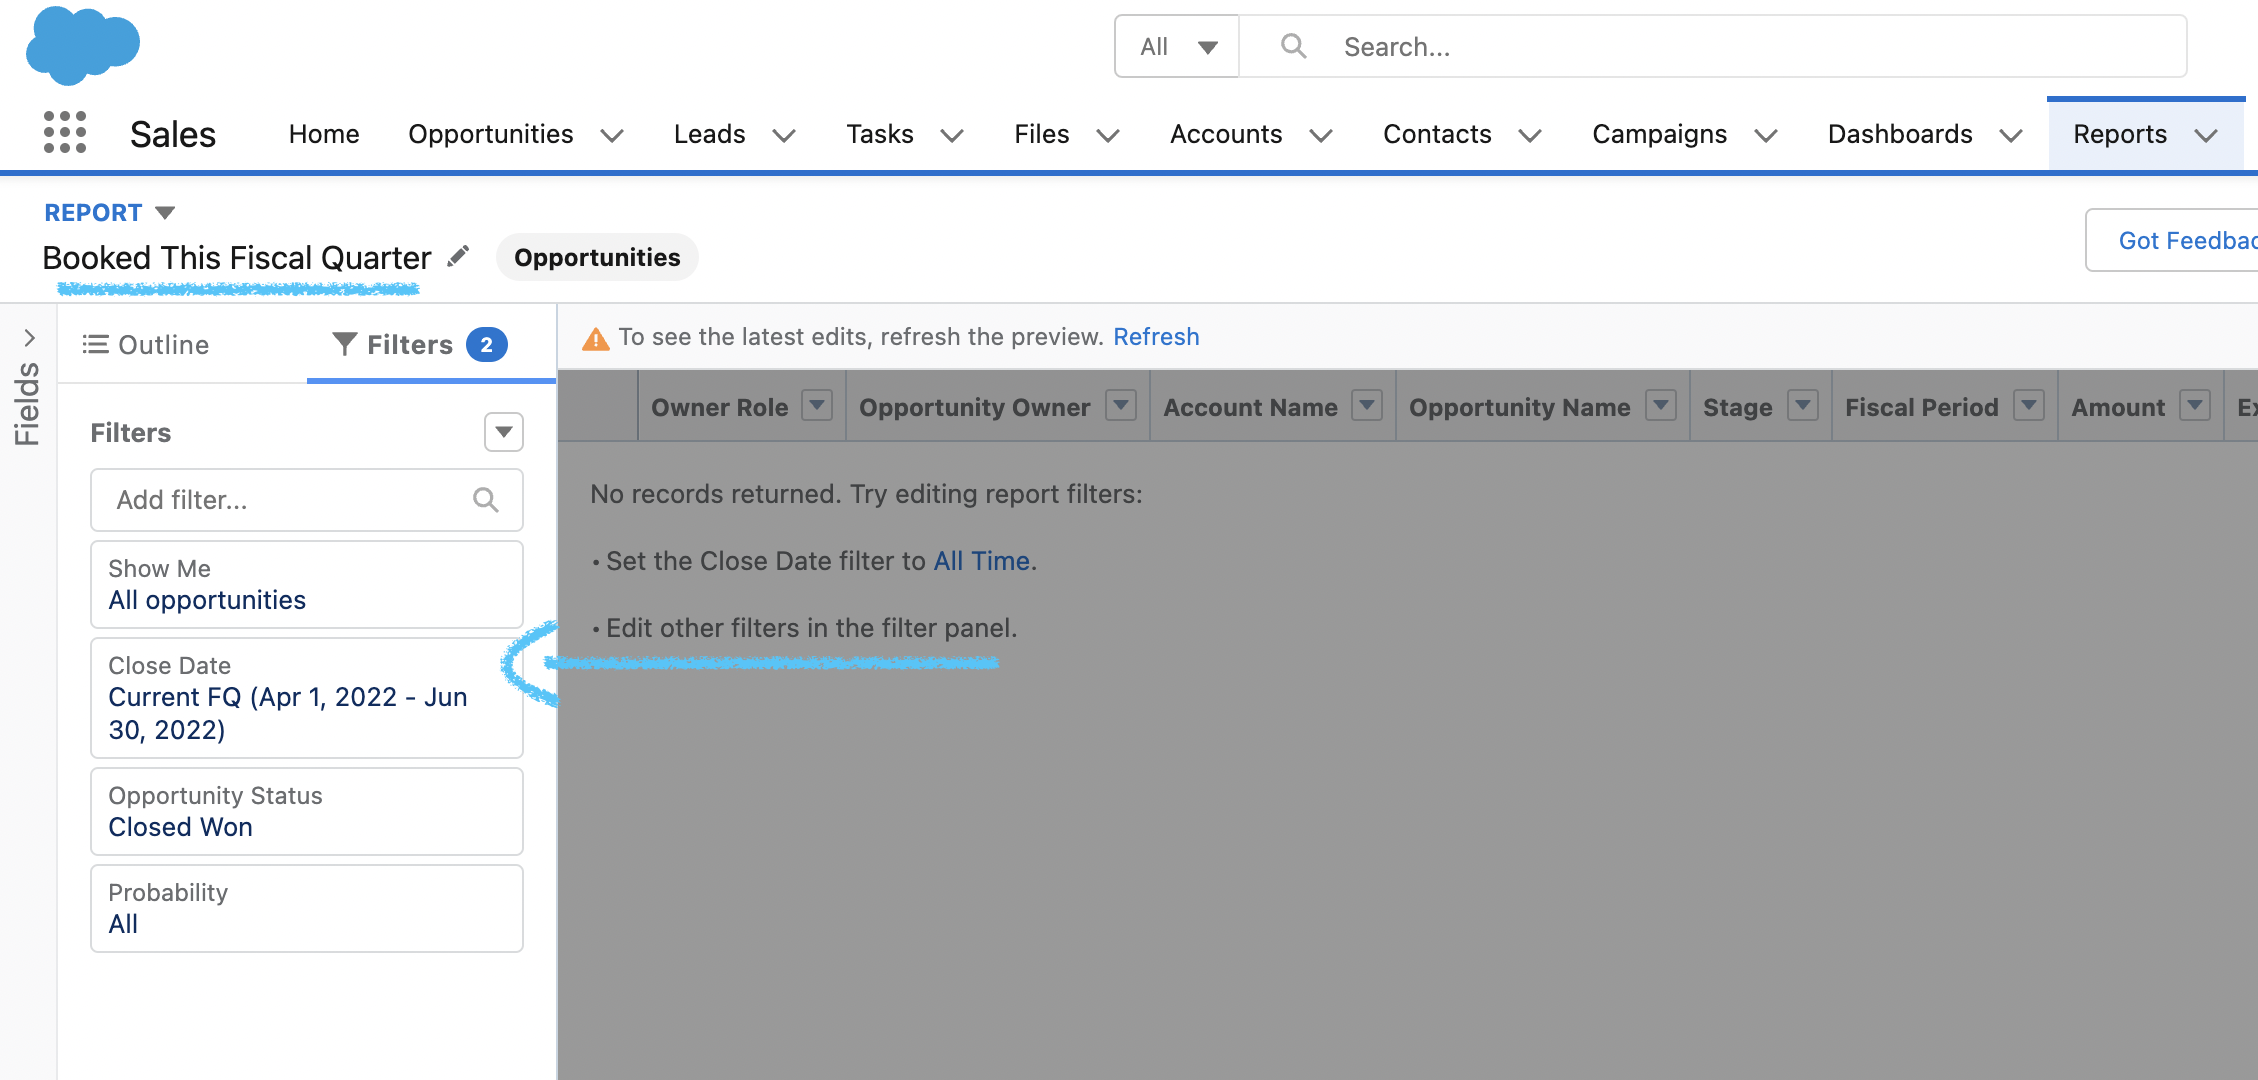
There is serious value conferred when companies implement a process to organize salespeople’s opinions on where they might end the quarter.
The key here is to have clear definitions around sales stages and forecast buckets:
- Where do deals objectively sit according to your sales process? Your opportunity stage should answer this question, at a glance.
- Where do reps and managers subjectively think they’ll close the quarter according to their judgment and experience? This should be tracked systematically and consistently at the opportunity level and during weekly deal reviews over time. Here’s a template for forecast buckets we like to see set up on the opportunity.
When this structure exists, forecasting known opportunities becomes easier and more predictable. Logical coherence is imposed. Sales teams are speaking a similar language. We can roll up forecasts by manager and territory to understand where teams think they’ll end up.
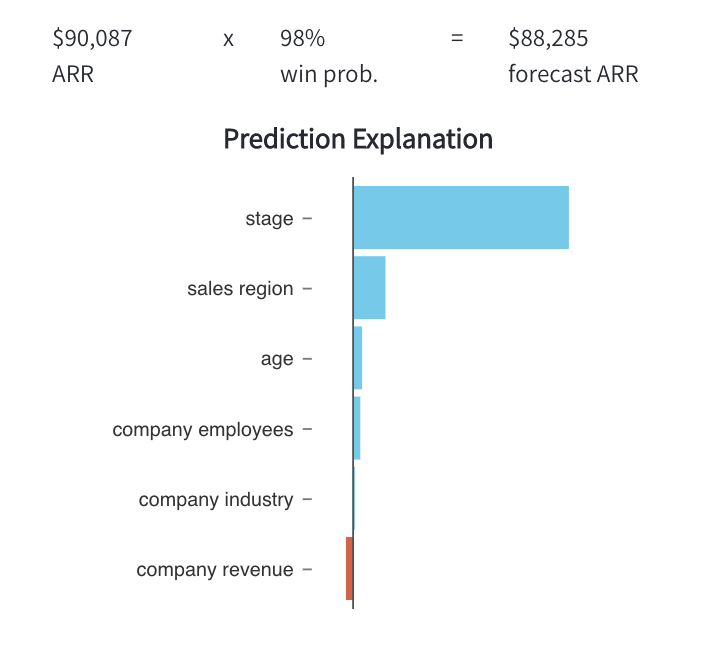
There are still blind spots, though. “In head-to-head competitions between people who use models and people who don’t, the former win, and typically do so by large margins.”2 This is where automated deal scoring, aided by machine learning and trained for your organization, can improve the accuracy of forecasts.
Deal scoring models are very useful. They should consider things like volume and recency of sales activities logged against a deal, the demographic characteristics of the buyer, the assigned sales rep, and so forth. The main complexity here is translating the disparate data from Salesforce into a format that a model can understand.
A 2017 study found significant improvements in forecasting outcomes when scoring models offered explanations for predictions.3

Known prospects without sales opportunities
For sales managers focused on the current quarter, here’s where we begin deviating from the “known” world of in-quarter forecasting.
Of course, CROs, CFOs, and CEOs own numbers beyond the current quarter. Someone needs to evaluate the quality of known prospects and the likelihood of their conversion to a sales opportunity.
What is a prospect, anyway?
Most B2B sales people end up selling to a champion and helping the champion sell to a buying committee. Before an opportunity is identified, we’re working leads. We may or may not know who the champion is or who is on the buying committee. When evaluating the quality of leads or contacts in Salesforce, we need to consider the characteristics of the multiple leads and contacts that make up a unique potential customer.
Traditionalists might argue that marketing qualified leads (MQLs) belong at the top of the funnel. They are wrong. Watch these folks implement their “scoring” system. It will be filled with bias and configured on the basis of good intentions.
A better approach is to gather those individuals, likely scattered throughout your business systems, into prospects—then evaluate the prospects. (You may need some help from your data engineering team or equivalent doing this).
So, to create a proper ARR forecast, you should treat a prospect to be a group of leads or contacts representing a unique company. We need to get our segmentation right—for the purpose of a new logo ARR forecast, prospects are companies that don’t have a pre-existing contractual relationship with your organization.
Evaluating prospects
The idea is to begin to identify characteristics across prospects that reflect the likelihood of conversion into a Salesforce account with an opportunity. This ideally covers demographic, firmographic, and event-based data. Examples of event-based data includes how prospect accounts are engaging with an SDR (LinkedIn, call, Outreach sequence, etc.), interactions with tracked marketing campaigns — plus the nature, frequency, and recency of these events.
There are a few different types of models that can be trained to predict prospect-to-opportunity creation. The model you choose is up to you, but it will require thoughtful elimination of outliers, selection of outcomes, and ongoing retraining as your business evolves.
Like with deal scoring models, the trick here is to efficiently extract and transform the data containing signals into a model-ready format.
For each prospect with meaningful engagement, the model should produce an inferred conversion probability. With that probability calculated, your waterfall calculation begins for expected ARR bookings from known prospects.
We’ll cover the metrics we need for the waterfall calculation next.
Prospects and opportunities that you will generate in the future
Things get more complicated here if you’re working in Tableau or Excel. If you’ve successfully grouped leads and contacts into prospects, you are off to a good start.
You might be asking, “how do I forecast multiple quarters of revenue bookings when the leads and opportunities aren’t even in Salesforce yet?”
We need to assemble a cohort-based view of our business, measure each cohort’s journey, then make informed assumptions about the type of productivity we can expect in the future4.
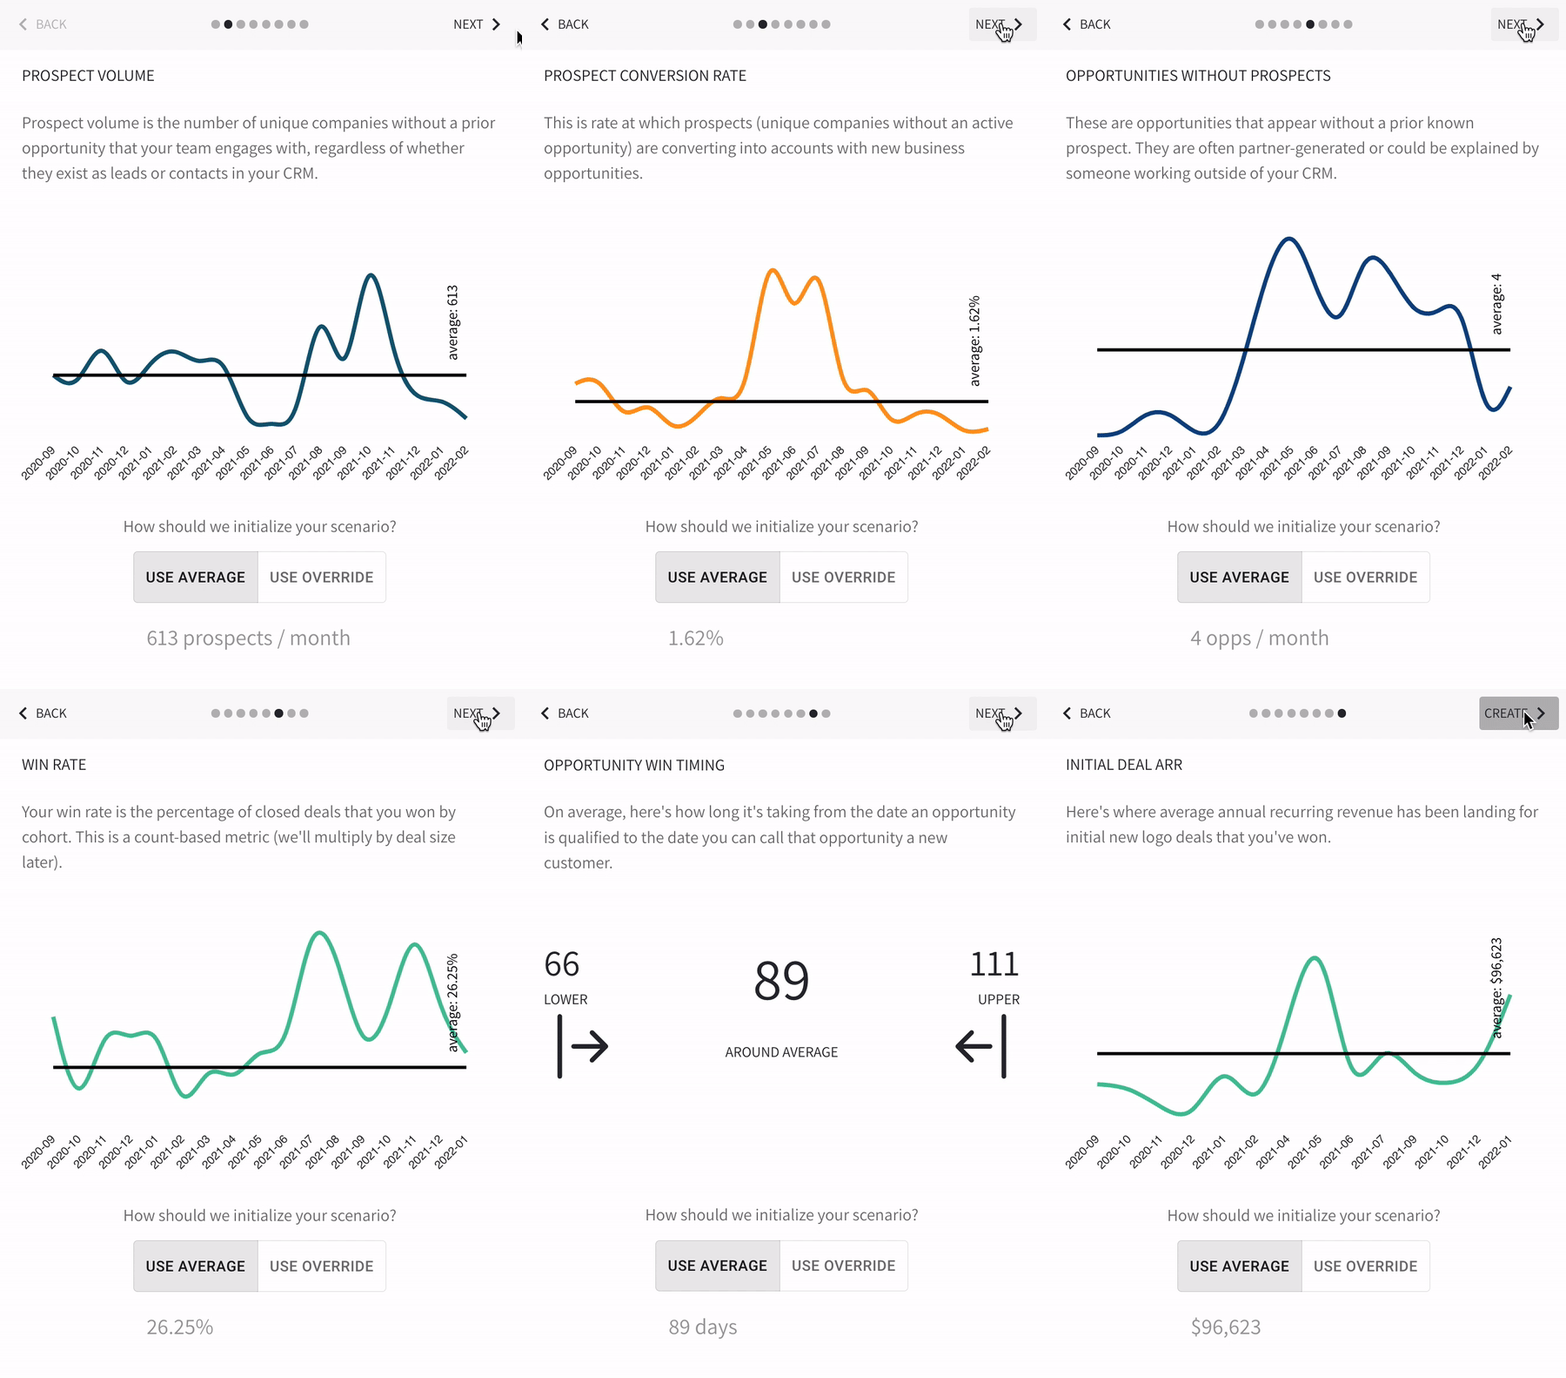
Here are the historical statistics you’ll need to measure by cohort in order to predict revenue associated with prospects you’ve yet to identify.

- Prospects:
- Volume
- Conversion Rates
- Conversion Timing
- Opportunities:
- Win Rates
- Conversion Timing
- Initial Deal Size
Your model will need to take conversion timing and where you are in a given quarter in order to blend results from this waterfall calculation with expected results from opps and prospects you have on hand.
Segmented scenarios
Most companies aspire to have heuristics about their business along a couple distinct parameters (e.g., mid-market vs. enterprise, product line, company size buckets). If your business has sufficient volume to use these segments in your forecasts, then you should segment your forecasts.
Segmenting your forecasts requires some effort. You will effectively need to complete the above work for each segment, ensure there’s no overlap, then roll up the results of each segmented forecast into an overall business forecast.
Assembling multi-quarter forecasts on QFlow
If you’ve made it this far and are setting out to build a repeatable process to forecast revenue, I have both sobering news and good news.
The sobering (perhaps obvious) news is that it’s not possible to create multi-quarter forecasts using Salesforce alone. The above process will likely involve Salesforce, your marketing automation platform, a data warehouse, and a series of spreadsheets. You will likely have to make sacrifices in terms of accuracy to get to an initial forecast. Keeping forecast inputs and results updated in real time will require resources and effort. We’ve been there. Doing this well can feel daunting.
The good news: QFlow delivers a streamlined interface for multi-quarter forecasting.
It works by sitting on top of Salesforce.com and (optionally) your marketing automation platform.
In under an afternoon and with virtually no setup time, QFlow…
- Automatically and retroactively assembles each of the components explained in this post
- Makes creating multiple forecasts (scenarios) as easy as clicking a button
- Allows users to modify scenario inputs, challenging teams to improve conversion rates and productivity
- Supports custom segmentation in scenarios
- Delivers powerful mechanisms to uncover and explore the drivers of growth
Interested in a free trial? Get started today or find a time on our calendar for a demo.
Notes
-
When shouldn’t you annualize ARR? This might sound like a strange concept, but ARR is a non-GAAP metric after all. In certain cases, it is judicious to avoid annualizing a short-term contract when booking ARR. For example, if sales closes a deal for a three-month proof of concept, many companies will only book the three month’s of expected revenue as the total ARR for the deal. The idea is to ensure an accurate measurement of churn. ↩︎
-
You can Scott Page’s post on multi-model thinking here ↩︎
-
Marko Bohanec, Mirjana Kljajić Borštnar, Marko Robnik-Šikonja, Explaining machine learning models in sales predictions, Expert Systems with Applications, Volume 71, 2017, Pages 416-428, https://www.sciencedirect.com/science/article/abs/pii/S0957417416306327. ↩︎
-
You might also be asking, “how do we think about the cohort date for a prospect?” The answer is to do it mathematically and systematically. With the right tools, you can represent the creation of a prospect incrementally and much more accurately. Rather than take the “first in” lead from a company and its creation date for cohort creation, a better approach is to spread the creation date over a period of time. ↩︎
